Political Involvement
Our representative democracy cannot survive without the active and informed participation of its citizens. The data suggest younger people, racial and ethnic minorities, lower levels of income and education tend to be underrepresented in the political process.
Examples of institutions in Nebraska include the state legislature (unicameral), public schools, hospitals, media, and businesses. High confidence in institutions reflects the perception that an institution can be trusted to do the right thing, have the public’s best interests in mind, and fulfill its function effectively. As the data will show, confidence varies widely by institution, as well as across different groups, such as race and ethnicity.
Political involvement includes direct action in the political process such as voting and contacting public officials, and also actions of political discourse like consuming news and discussing politics.
Overall Political Involvement Highlights
- Nebraskans do well relative to the nation in self-reported voting in local elections
- Several political activities other than voting are estimated to have increased in Nebraska from 2013 to 2017, including:
- Discussed politics with friends/family frequently, where the increase in Nebraska mirrored a national trend of increased activity.
- Contacted or visited a public official, the rate of which is estimated to beat the national average.
- Bought or boycotted a product for political reasons, which also corresponded to an increase across the nation.
- In Nebraska, and across the nation, only a small percentage of people donate to political campaigns.
Voting
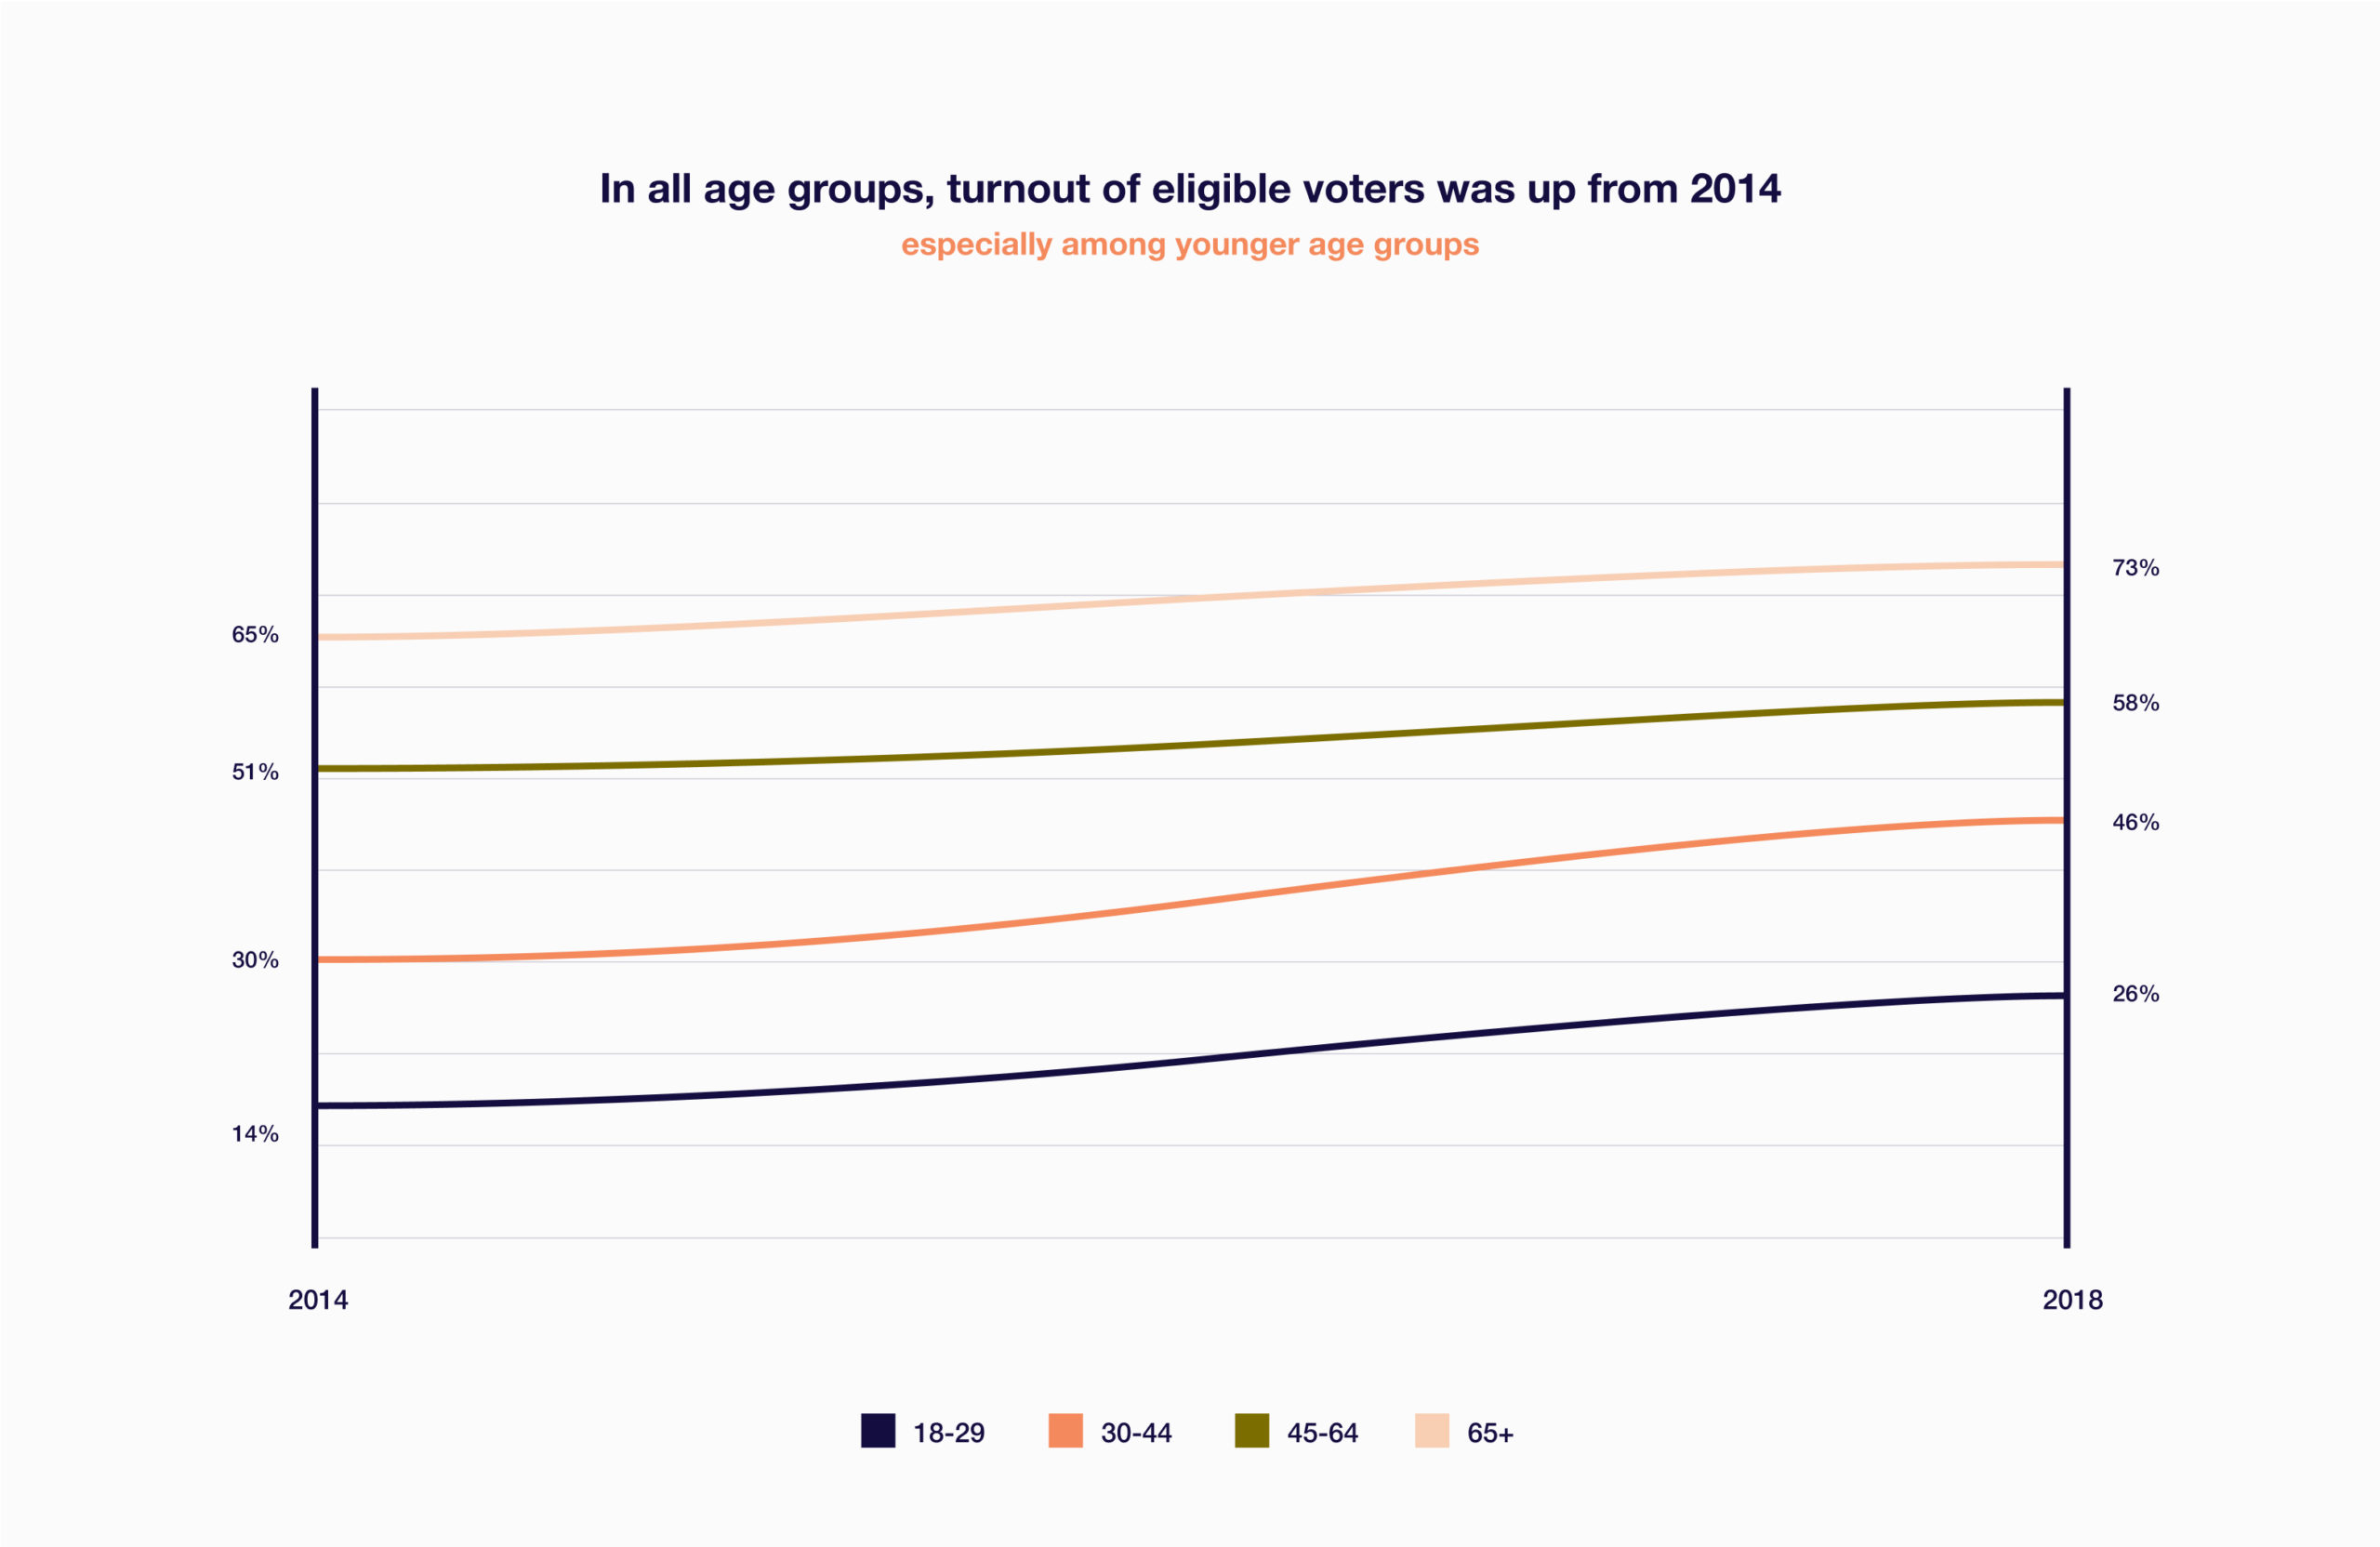
It’s worth mentioning that while Nebraska’s “rank” in voting rate relative to other states improved from 2012 to 2018, the percentage of Nebraskans who voted was estimated to be lower in 2018. This could be attributed to the fact that 2012 was a Presidential election year, which often motivates a larger turnout, and 2018 was a midterm election.
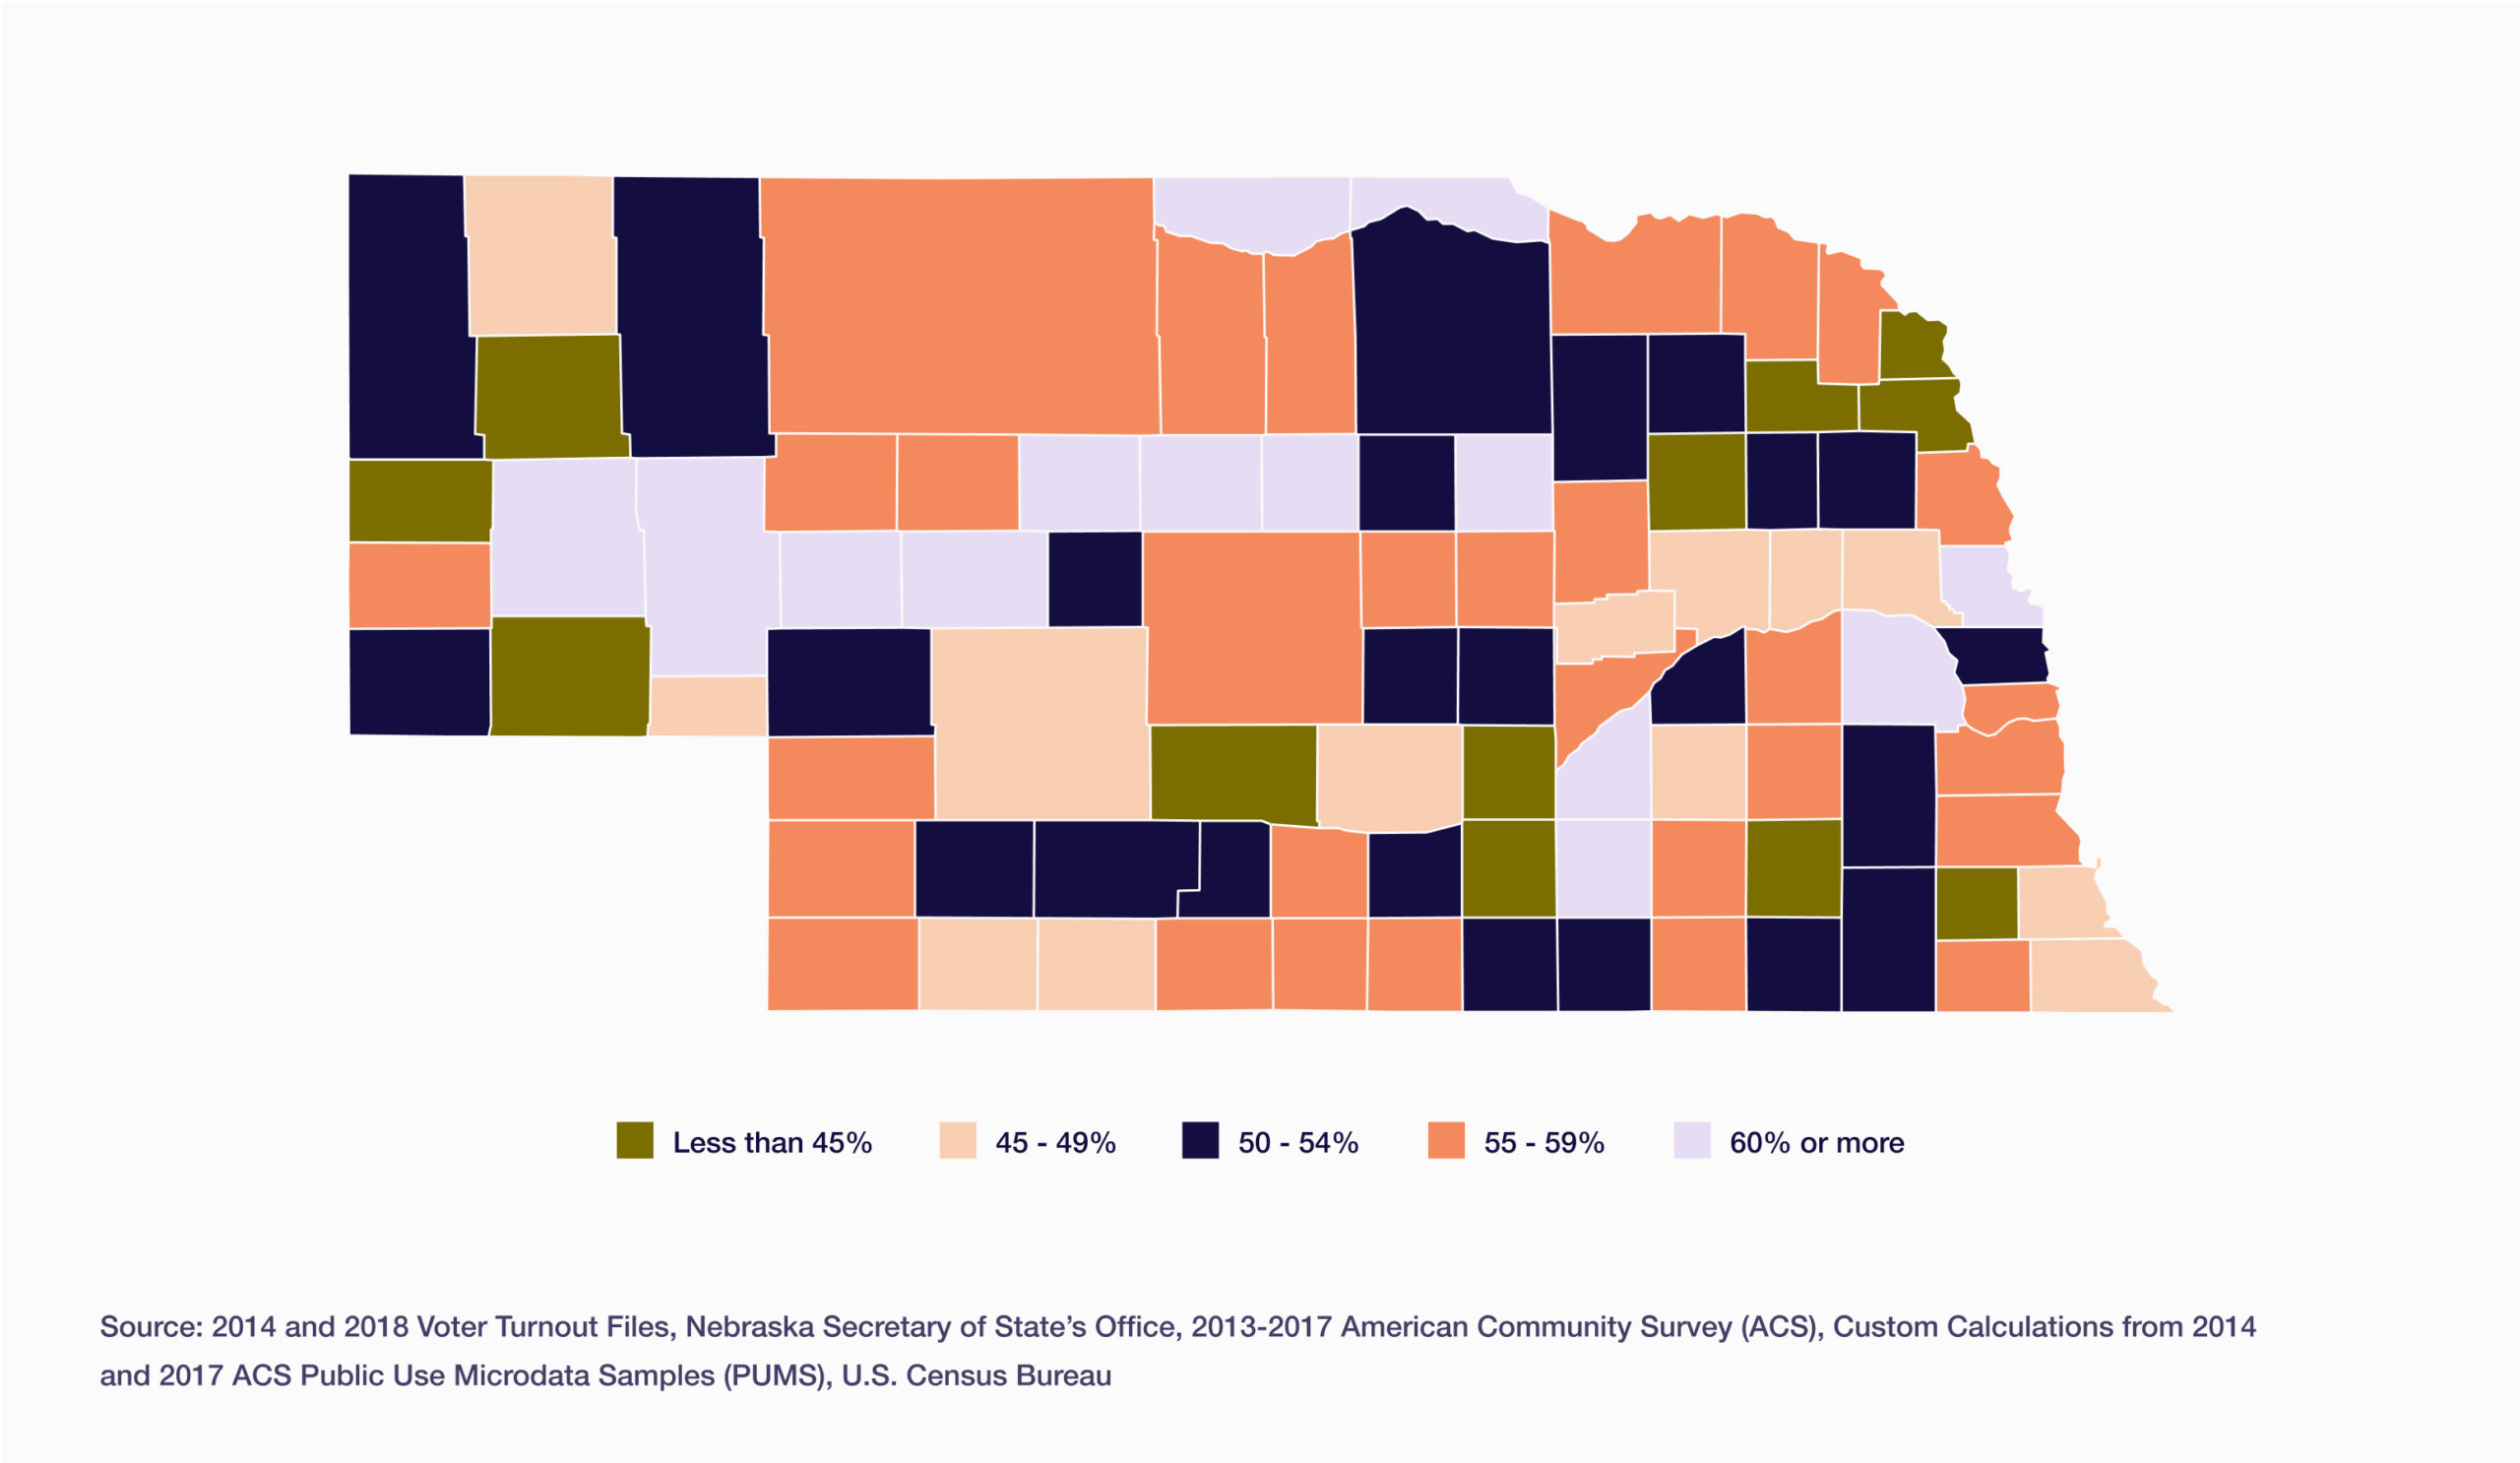
UNO’s Center for Public Affairs Research analyzed the Secretary of State’s data for 2018 voting and registration. The image above shows the geographical distribution of voter turnout in 2018, black colored counties being less that 45% turnout (12 counties) and deep red being 60% or more (14 counties).
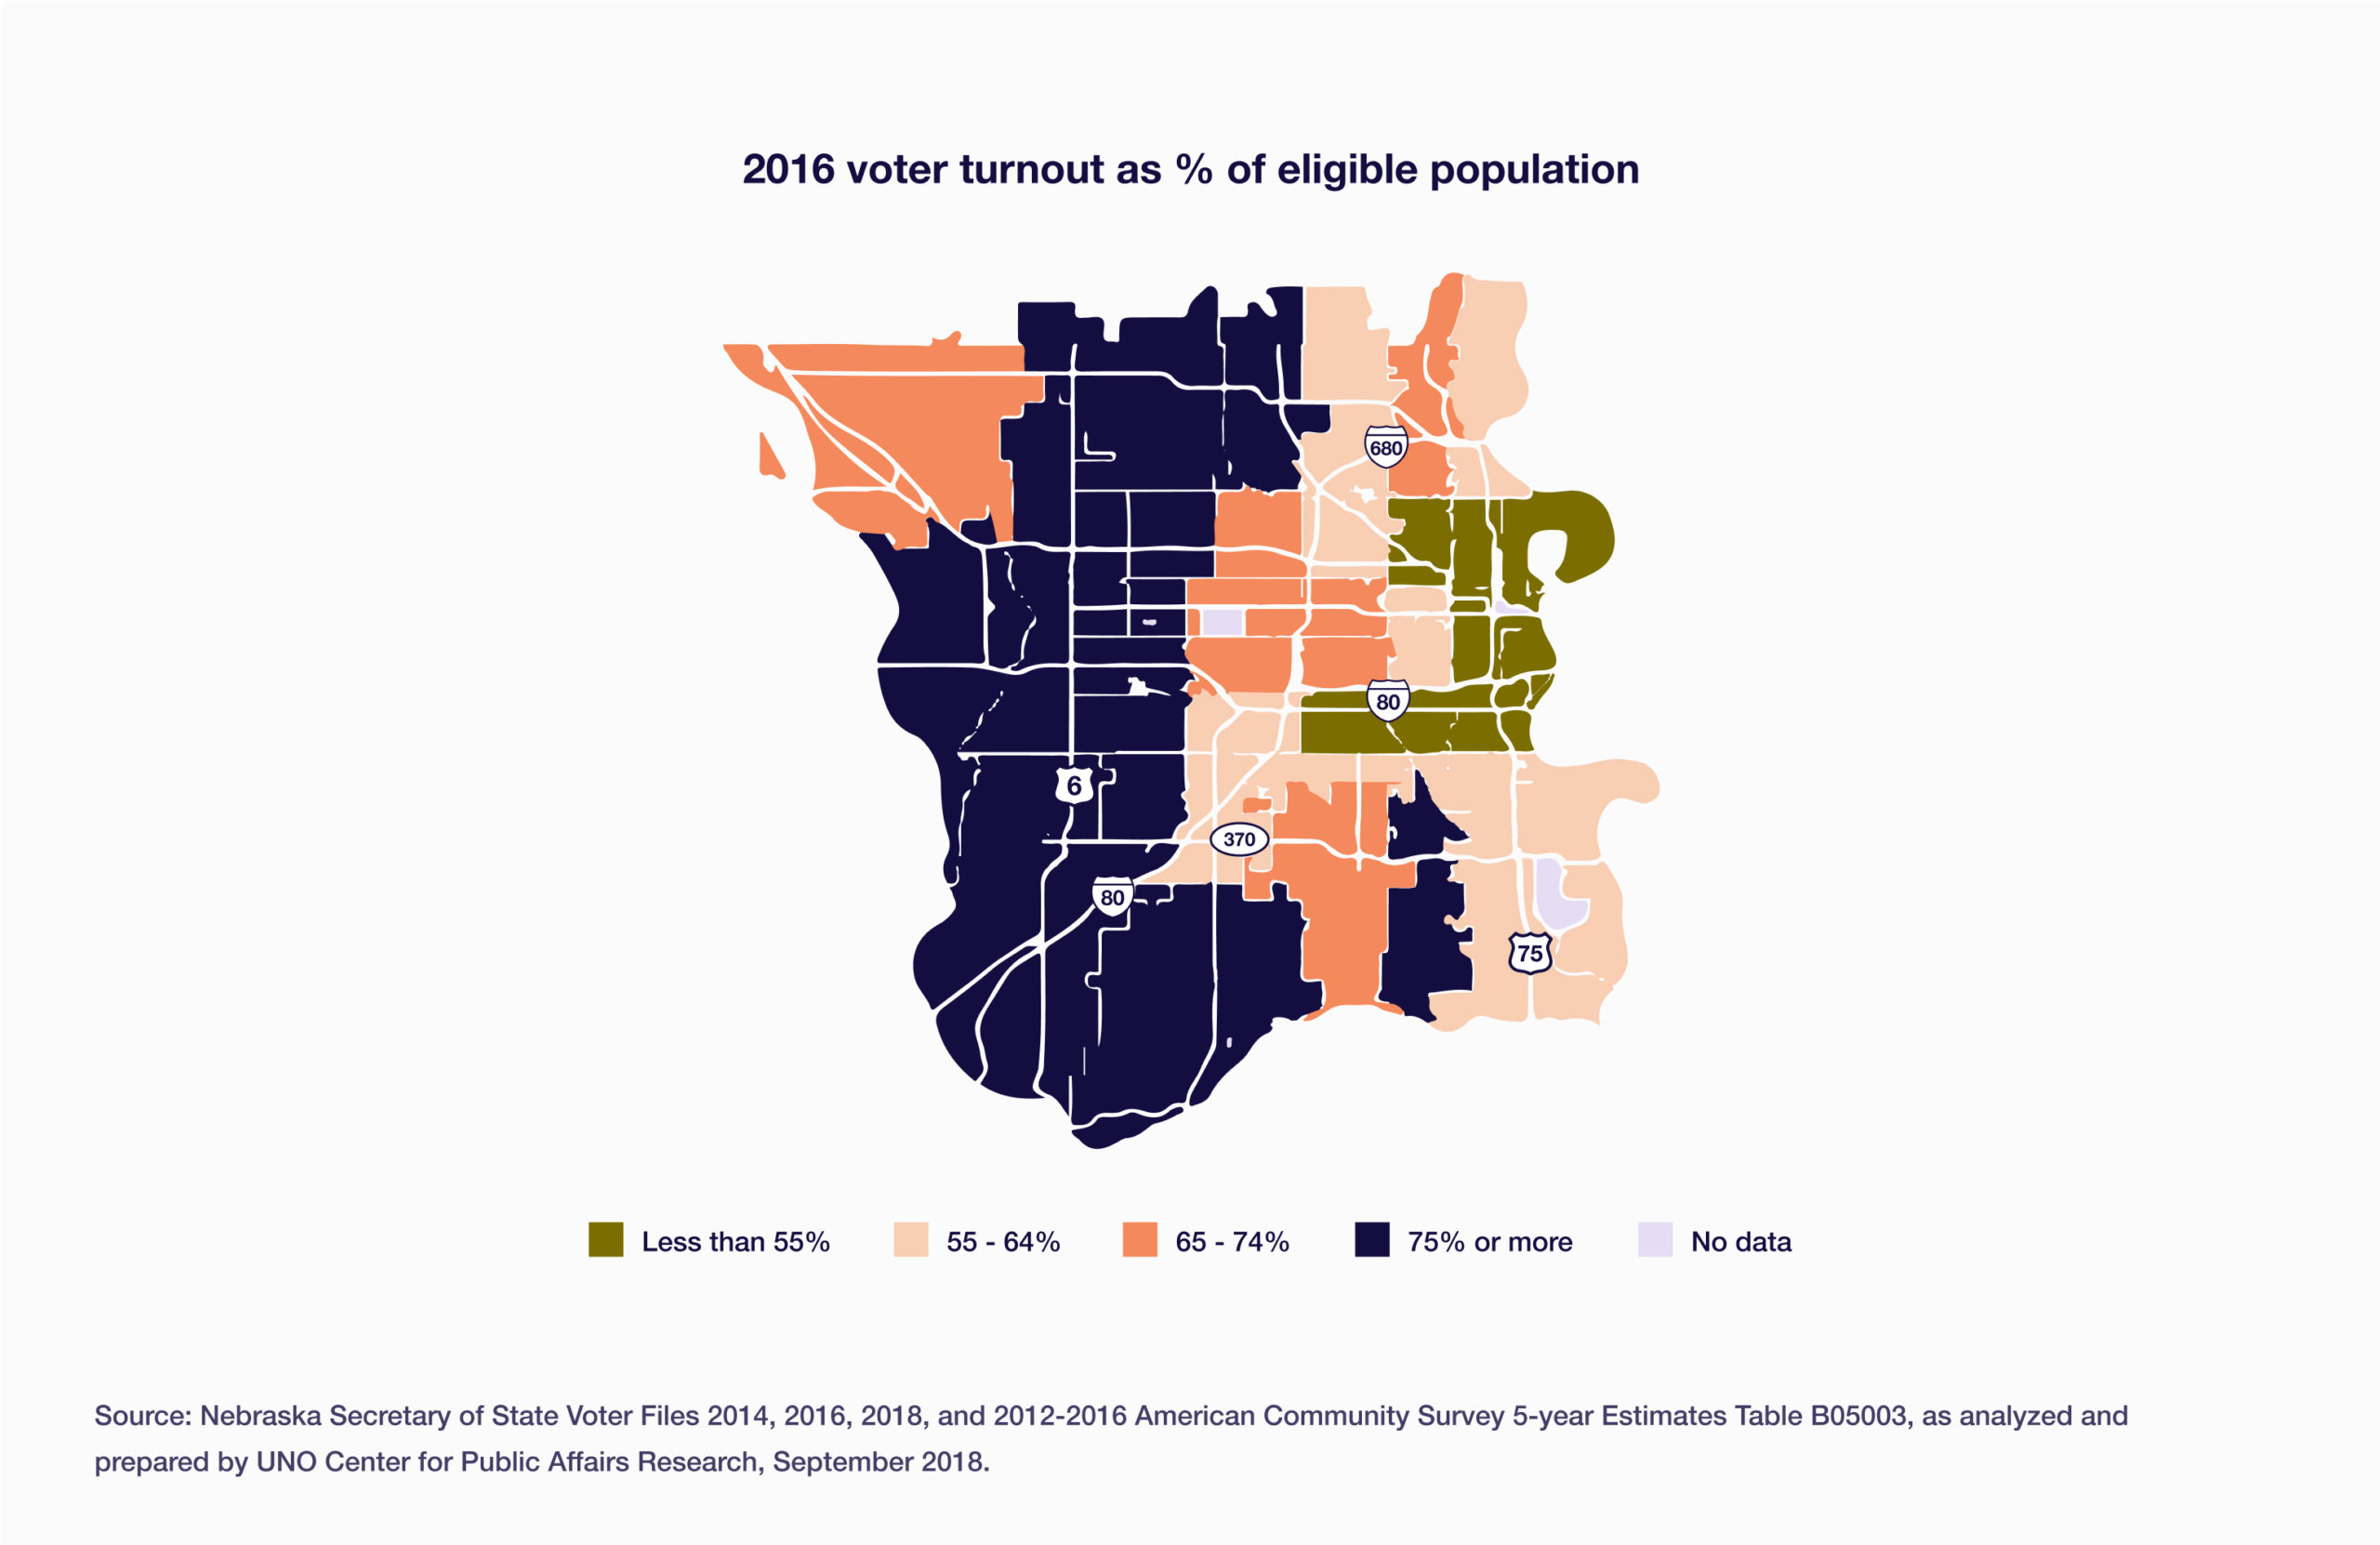
The low-turnout counties in 2018 were largely the same counties with lower turnout in 2016. A 2018 report by the Center for Public Affairs Research found that the counties with the highest percentage of Latino population in 2016 had an average voter turnout of 58% compared to 73% voter turnout in the counties with the lowest percentage of Latino population. In the Omaha Metro area, the areas which had the lowest voter turnout correlated with the areas of lower education, lower household income, percent Hispanic, and percent Black population.
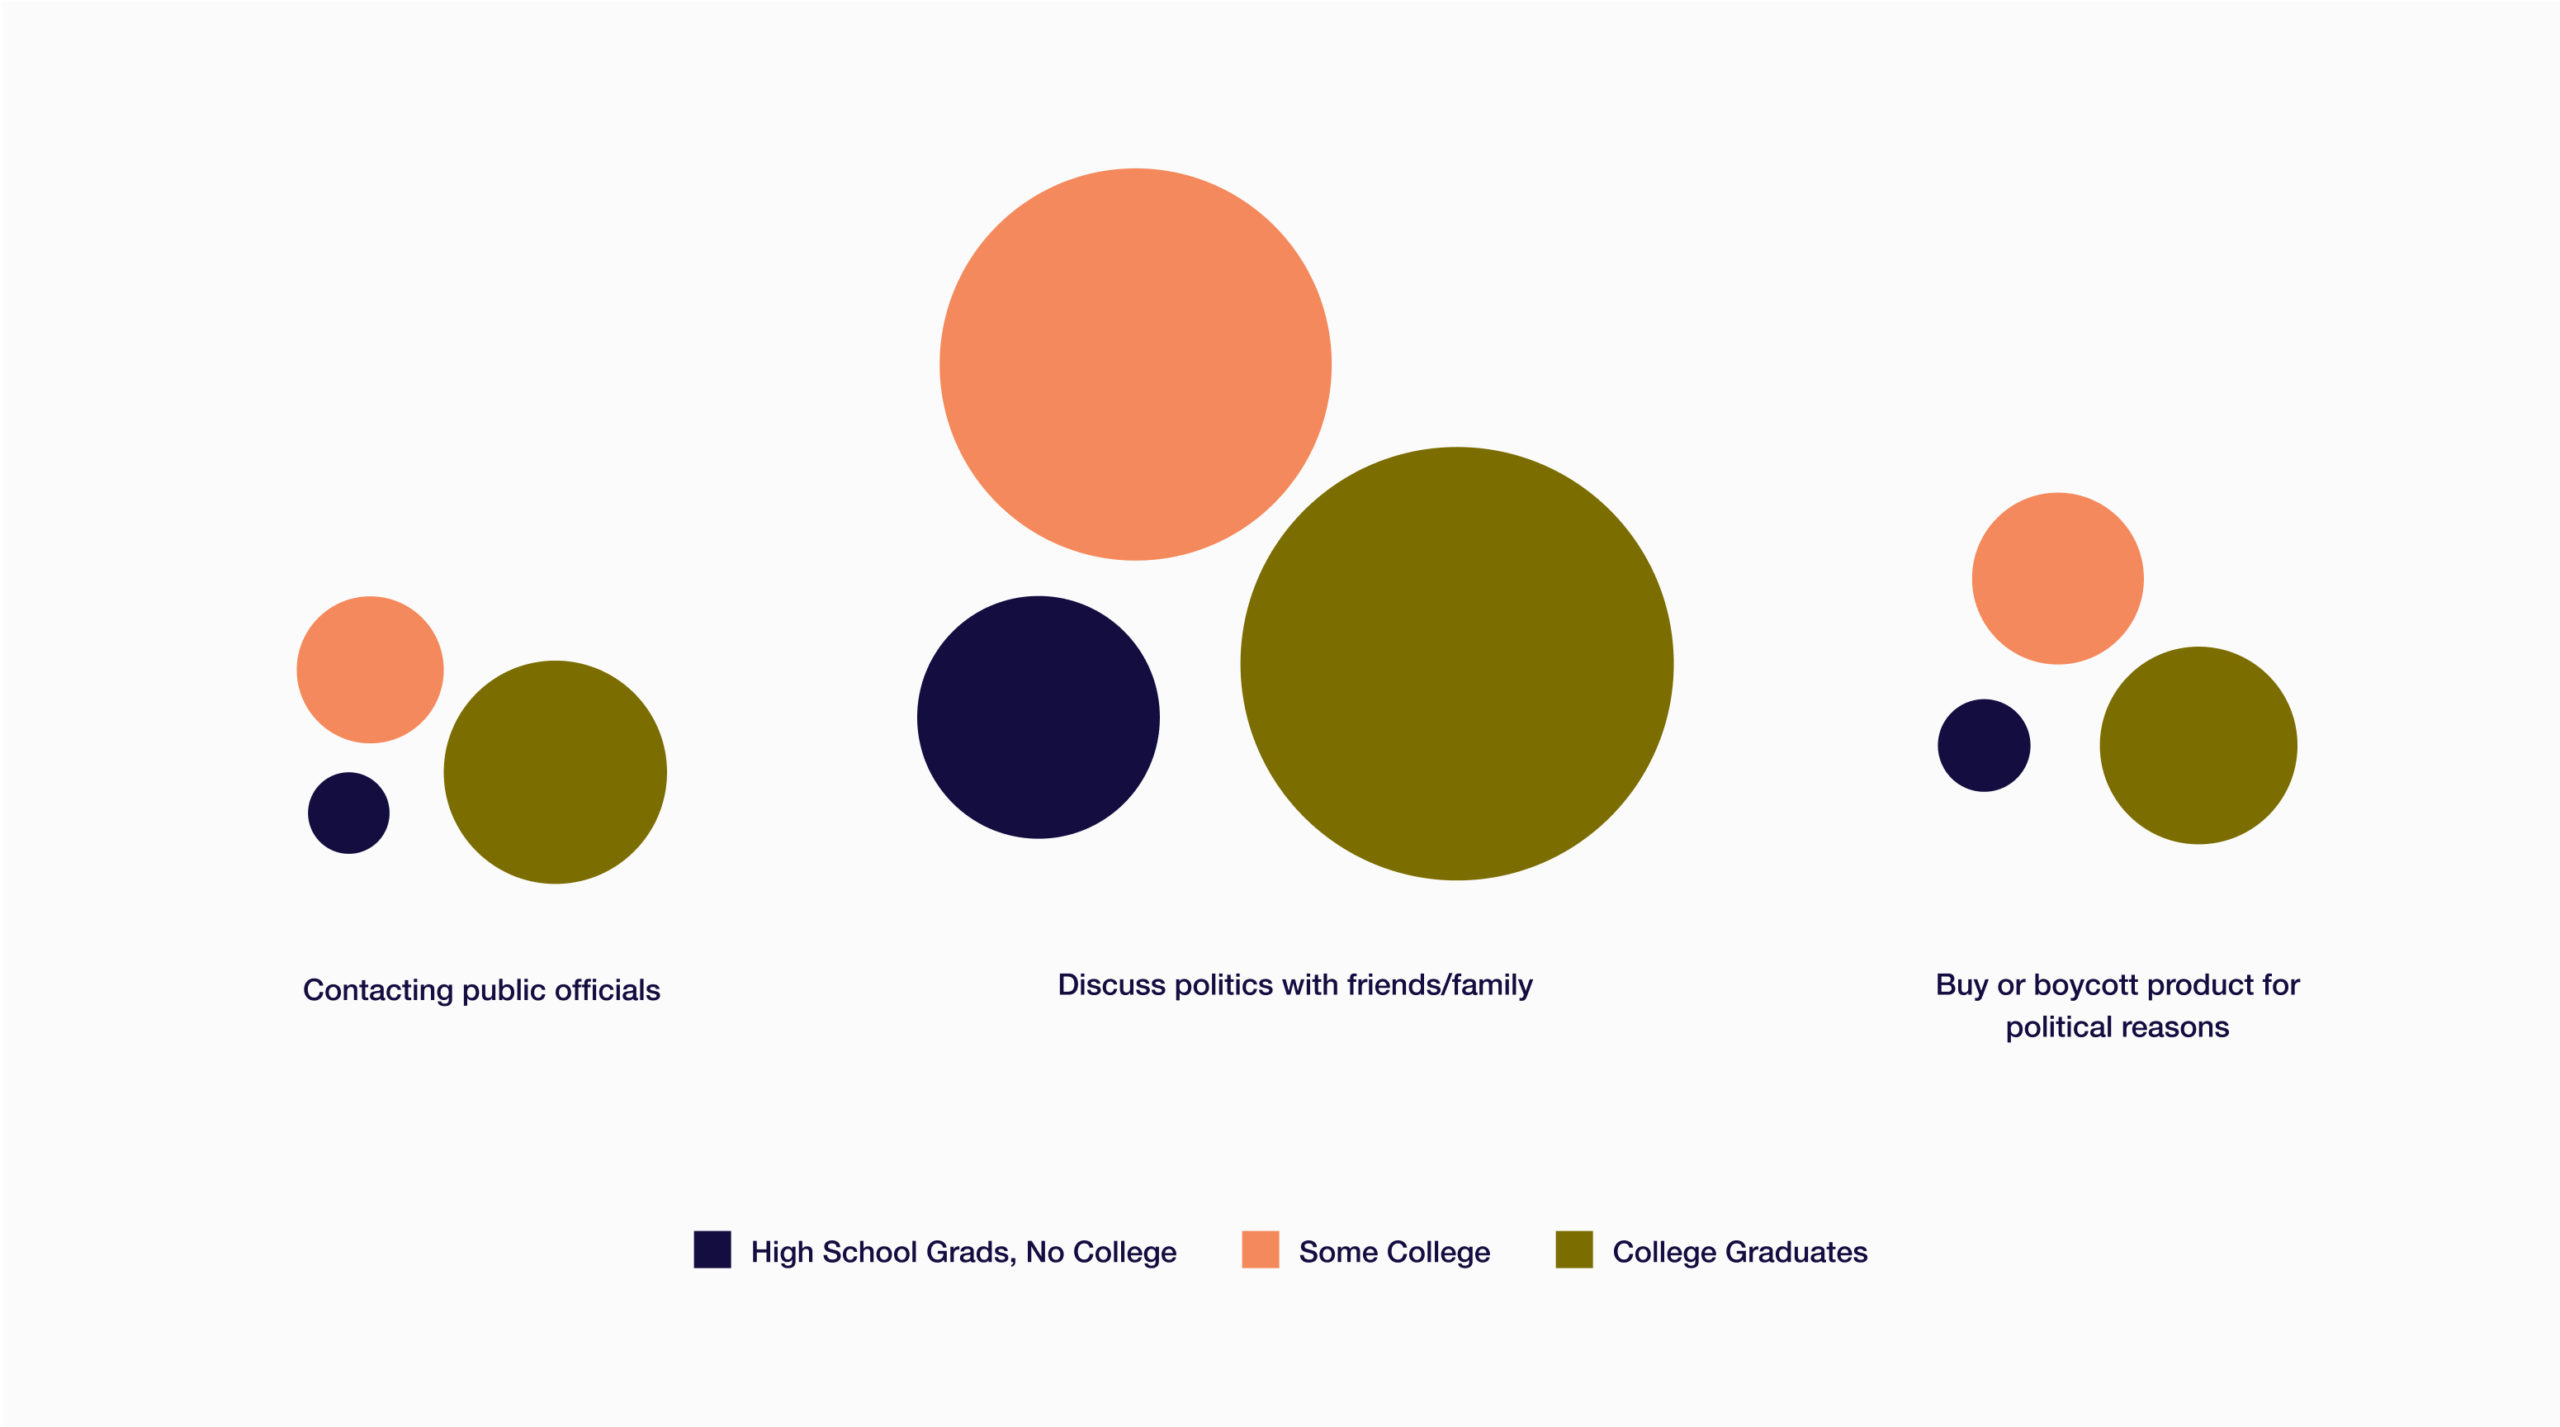
These trends also align with the data that suggests the people with lower levels of education and income tend to be less likely to be politically involved through contacting public officials or discussing politics with family or friends. Lower levels of political participation among persons of color, persons with lower-income, and in certain geographies means that these groups and areas are underrepresented in the election of officials who make decisions, potentially undermining the accountability of elected officials to all constituencies.
In the CPAR analysis, the 2018 turnout data aligns with the CPS estimation at 51% turnout for the 2018 Midterm election, but registration data was significantly higher than the CPS estimates, with only 11% of eligible voters not registered to vote for the 2018 election.
Discussing Politics
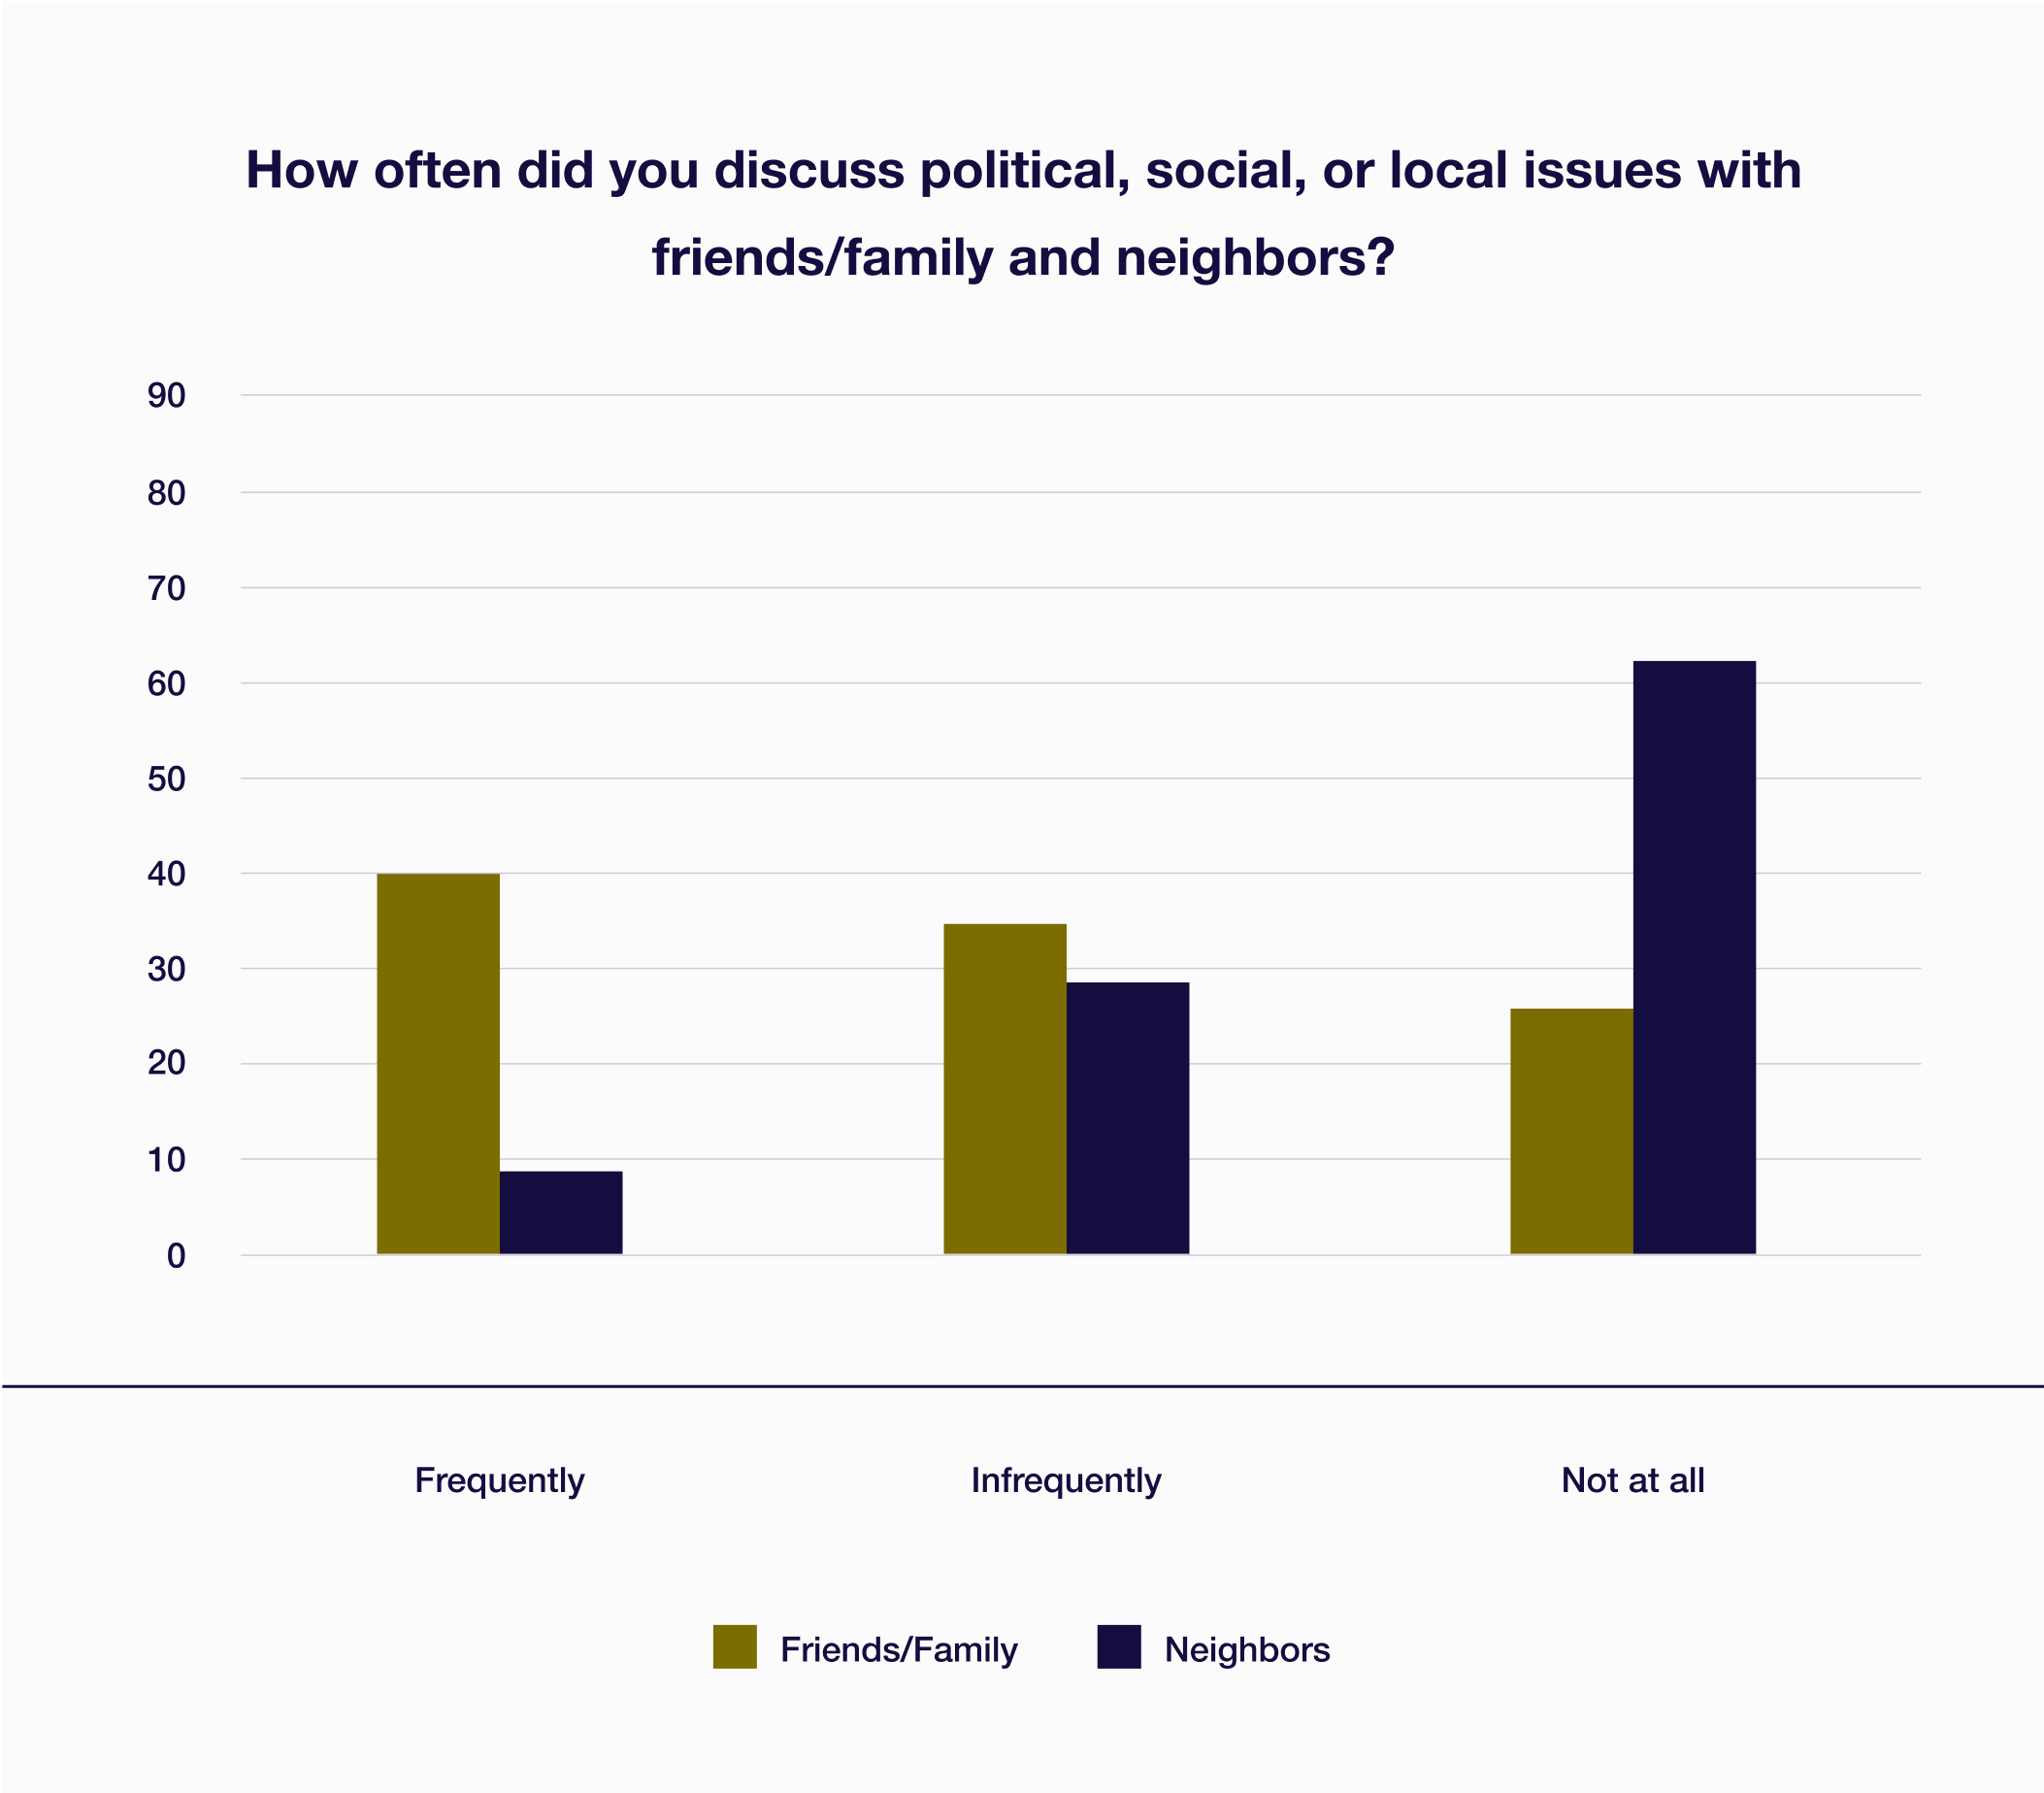
Nebraskans are far more likely to discuss politics with friends and family instead of neighbors.
As noted earlier, college graduates are more likely than those with lower levels of educational attainment to discuss politics or societal issues with friends, family, and neighbors.
Geographically, 44% of people from Nebraska Metro areas reported discussing politics frequently with friends and family, whereas 33% of people from non-metro areas discuss politics frequently.
Examining civil discourse in the online sphere shows the vast majority of Nebraskans (8 out of 10) claim to not post their political views on social media. Interestingly, there weren’t significant differences between age for this variable.
Competitive races in elections
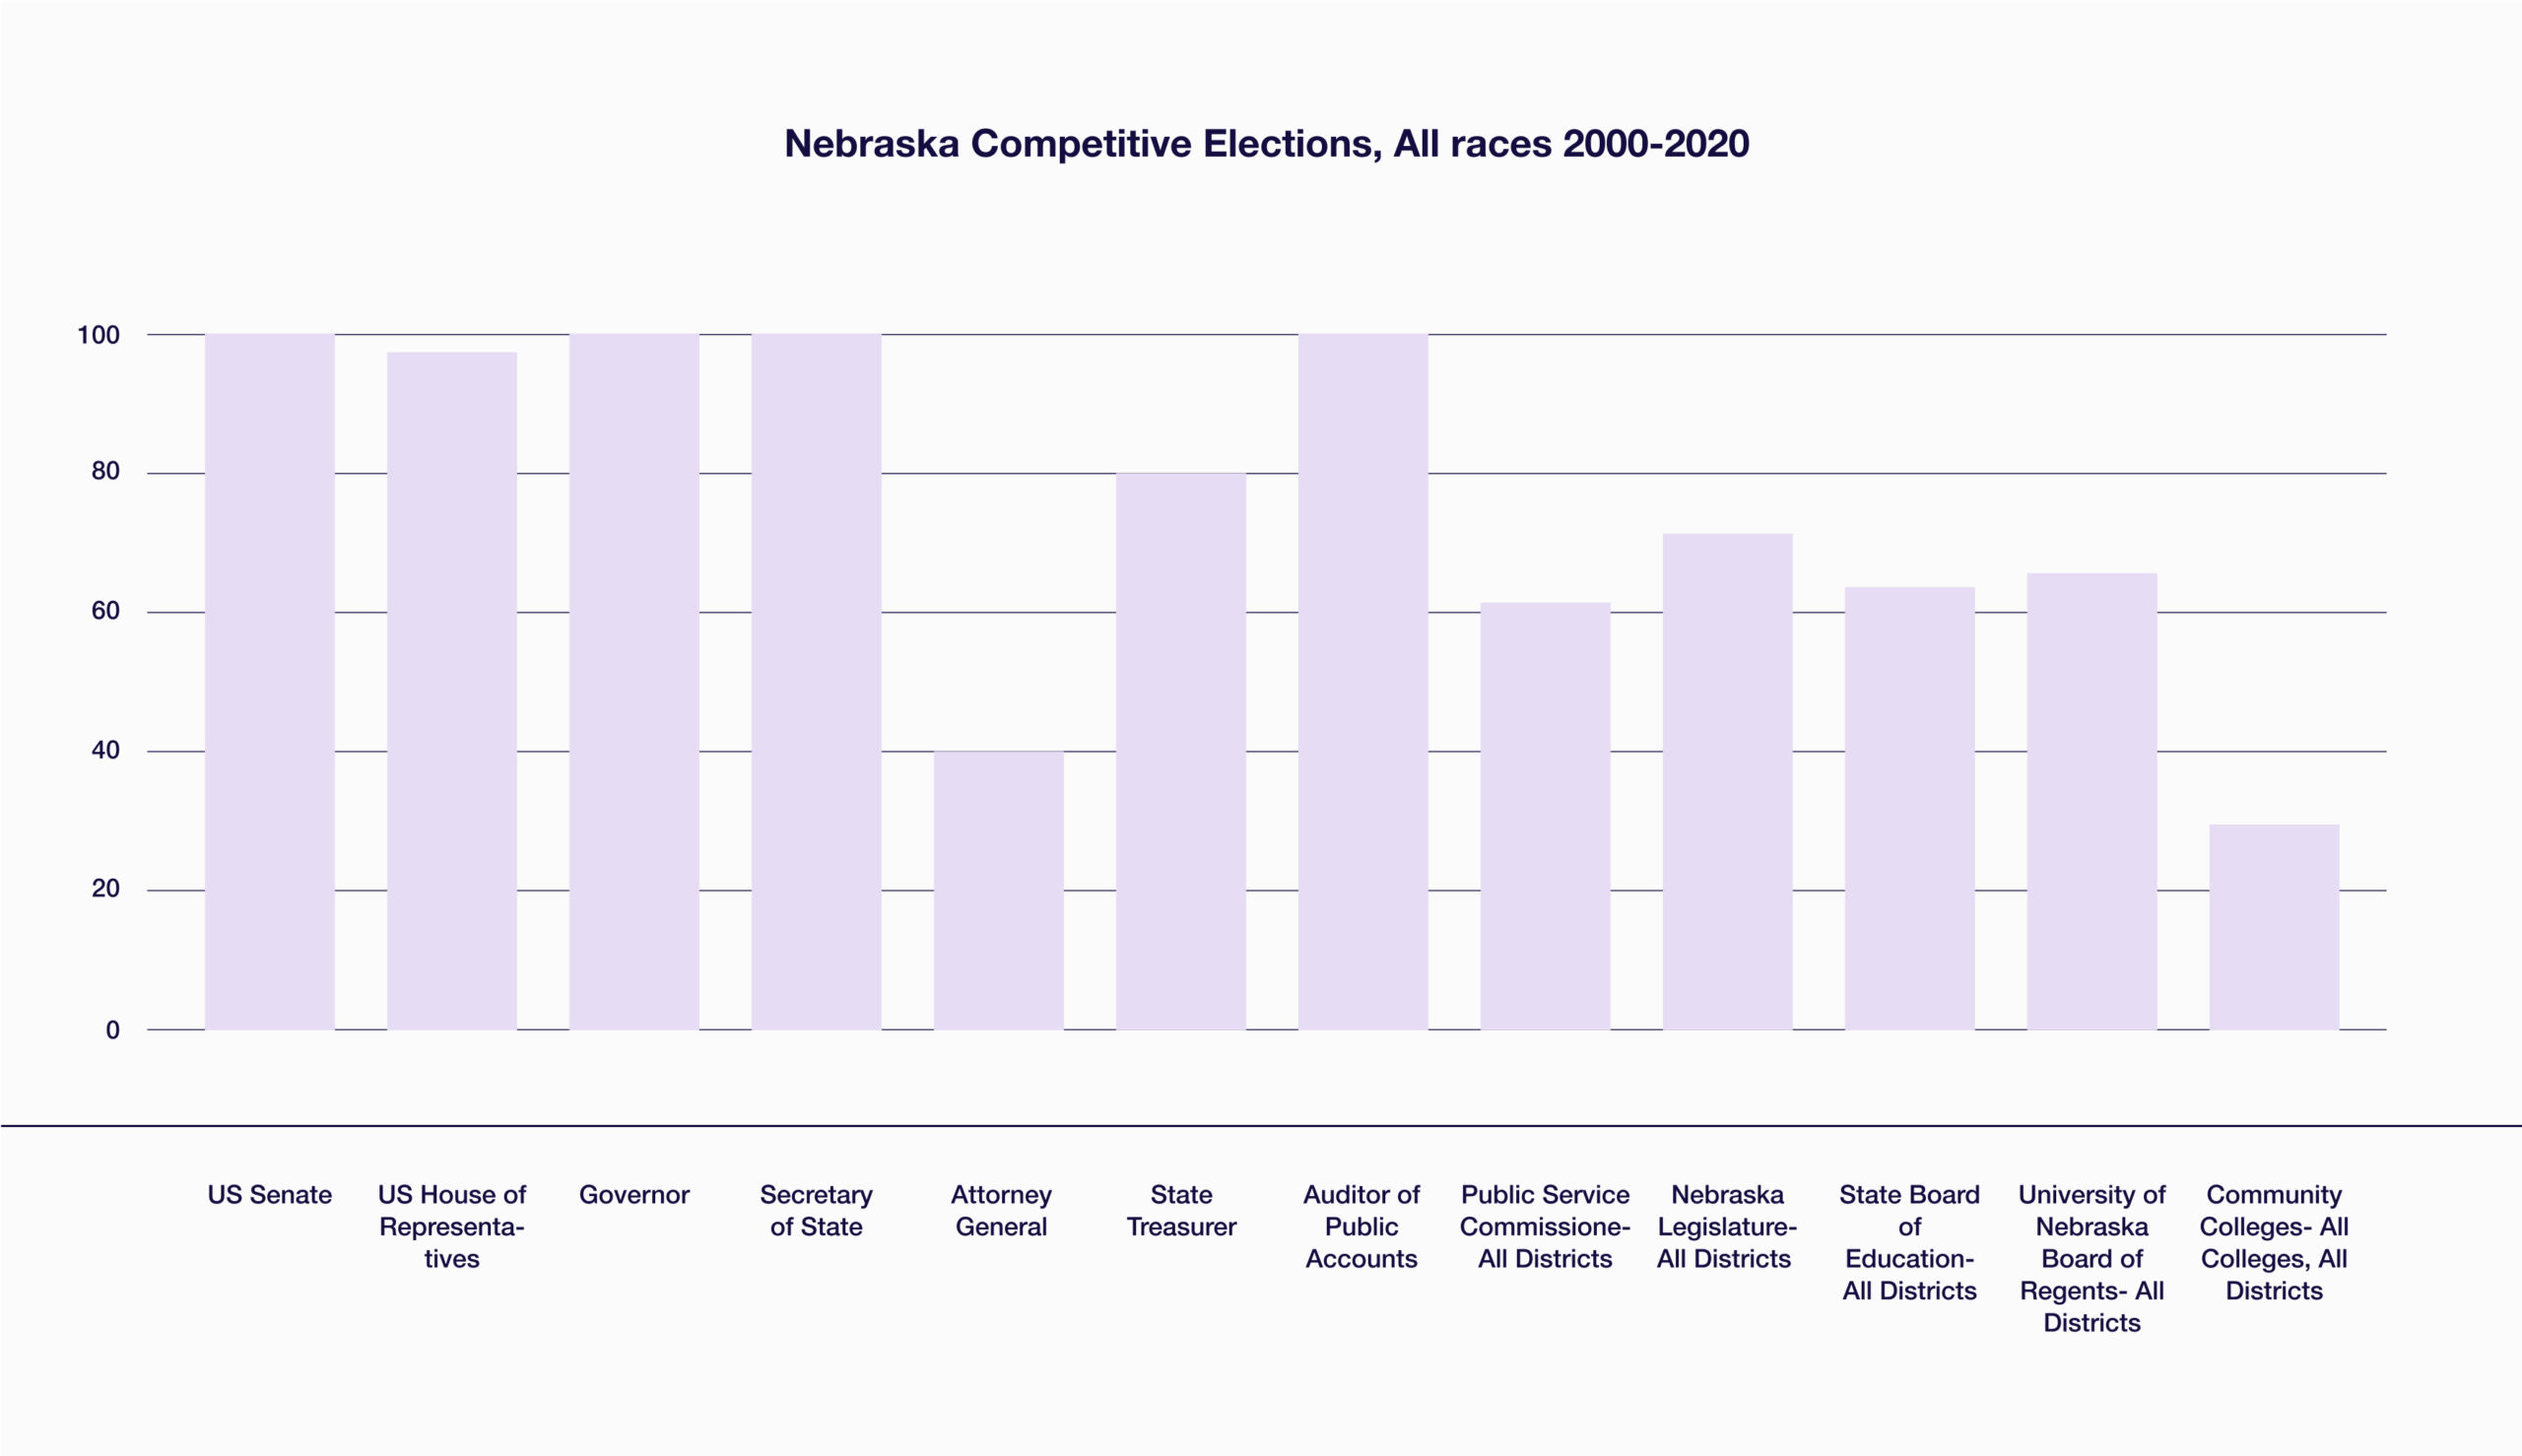
Nationwide polls indicate that just 2% of Americans have ever run for office. Anecdotally, it is said to be difficult to find people to run for public office, particularly for local offices in rural areas of the state. Competitive races for public office (races where candidates don’t run unopposed) provide voters a choice of visions and candidates, and can indicate, to some extent, participation in the political process.
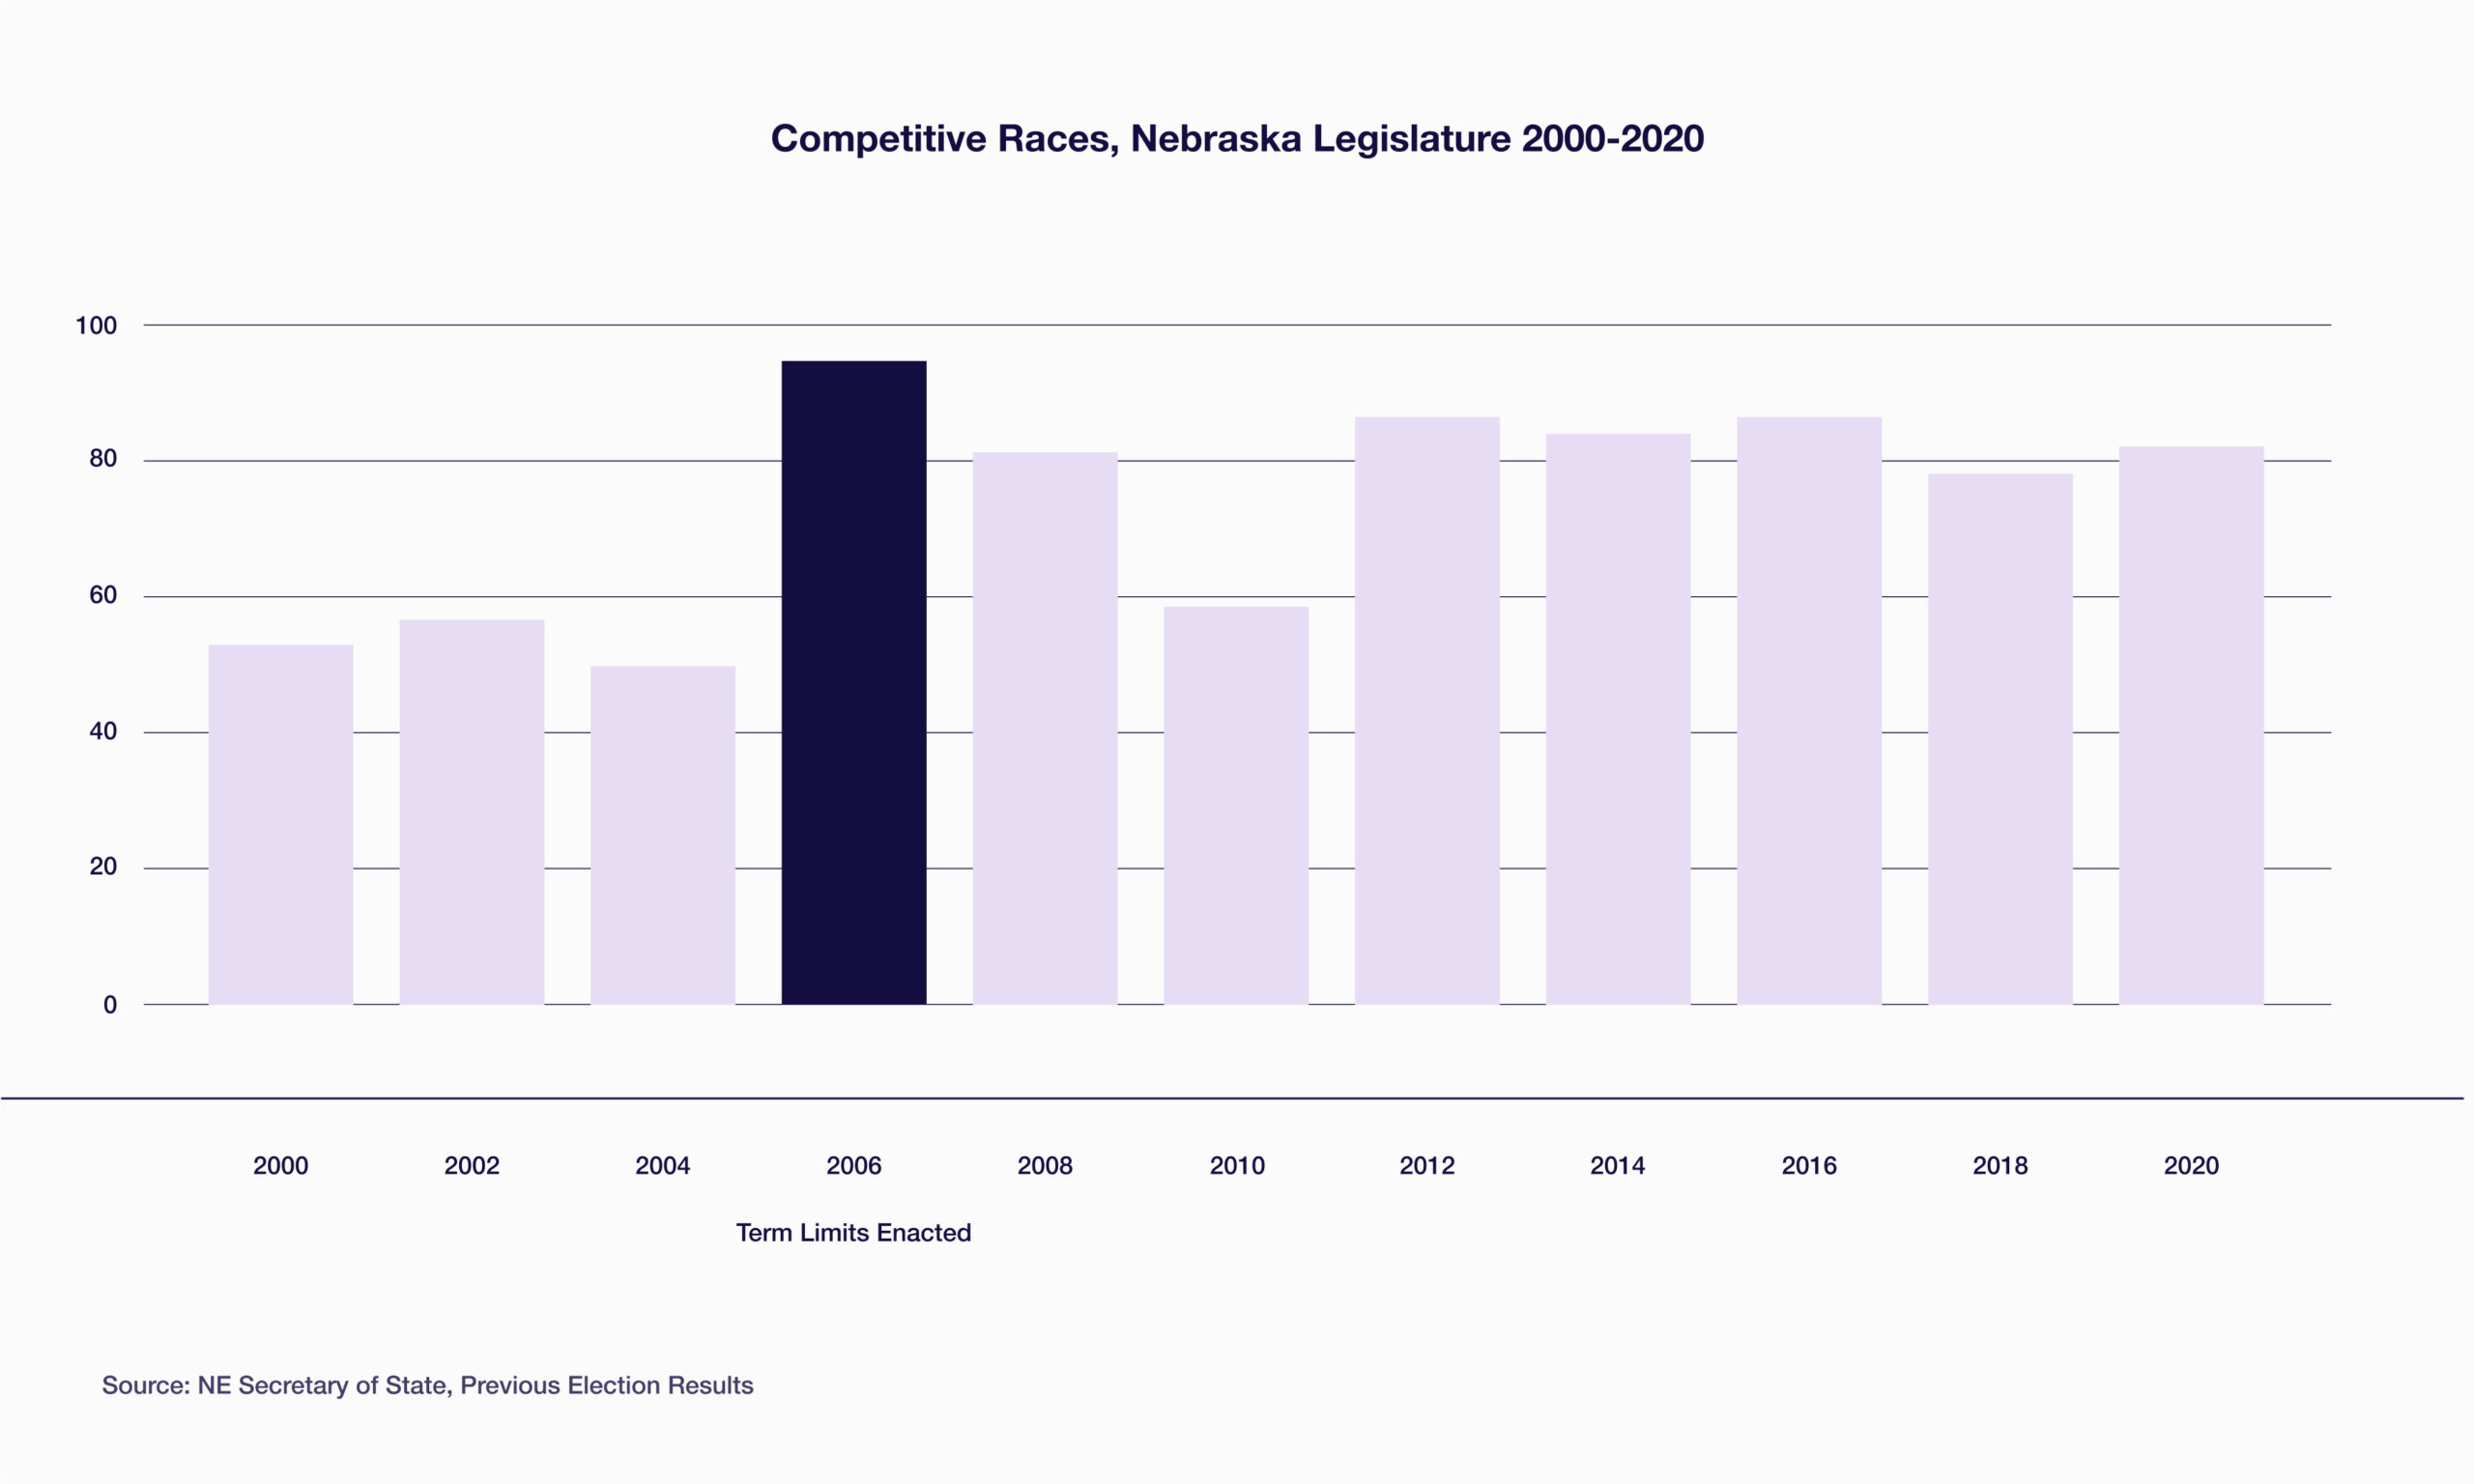
Within governing bodies, competitive elections vary by geography as well. In the Nebraska Legislature for example, the percent of races that have been competitive from 2000-2020 range from 33% in district 19 (Madison and Stanton Counties) to 100% in several districts in Douglas and Lancaster Counties. The effect of term limits, which were enacted in 2006 after a constitutional amendment passed by Nebraska voters in 2000, can be seen in the percentage of competitive races for Nebraska Legislature seats. In the three years prior to 2006, the average percentage of competitive races was 53%. In 2006 and years since, the average percentage of competitive races was 81%.
Some controversy has surrounded this change, however, with proponents arguing the higher rate of turn-over is beneficial by getting more people involved and opponents saying it undermines expertise of the body as a whole and ability to address long-term issues.
